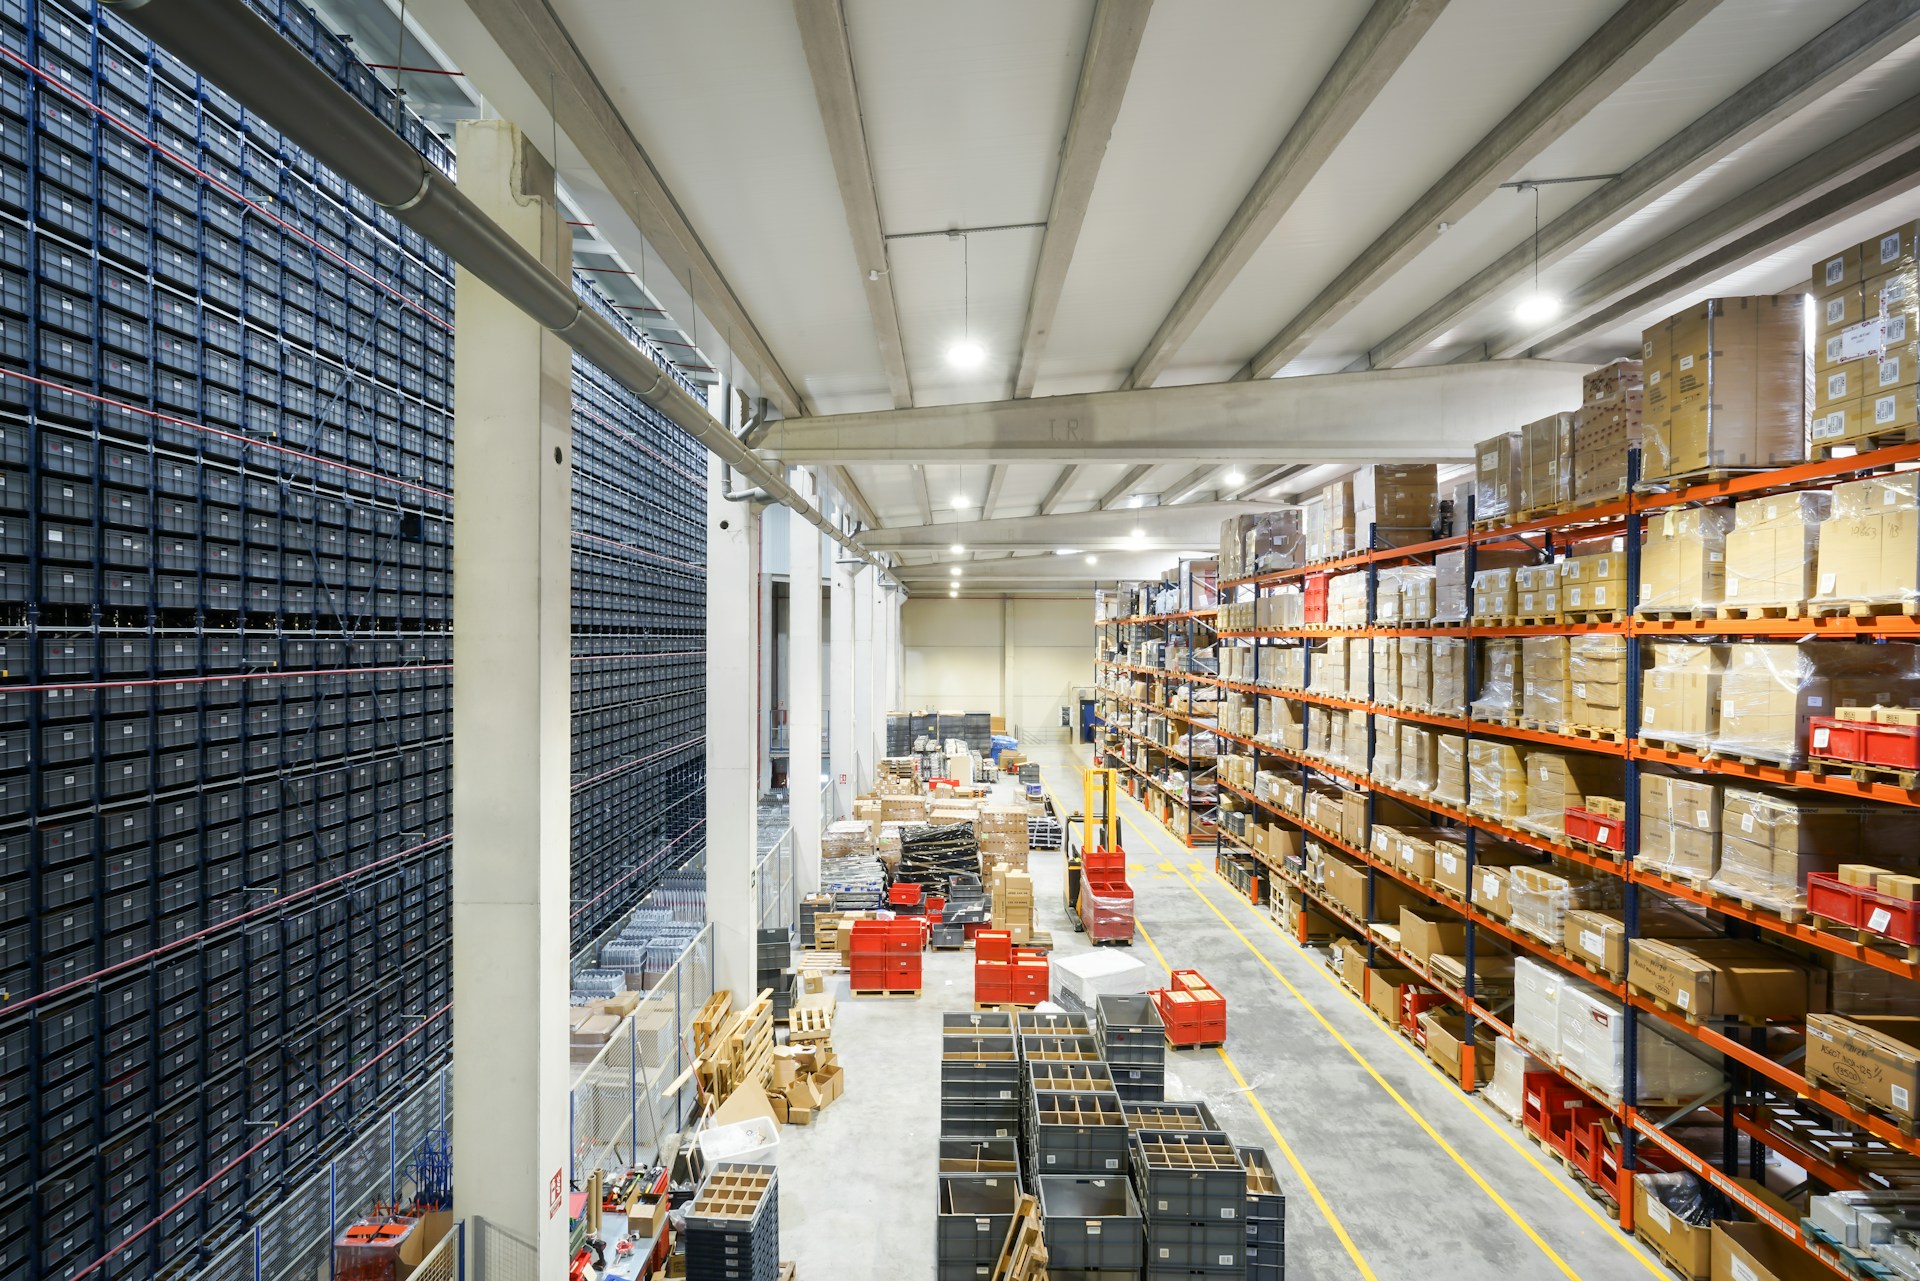
A plant can run out of usable space long before it runs out of square footage.
Pallets fill temporary staging zones. Work-in-progress collects beside production lines. Vehicles wait in aisles because loading areas are occupied. One section feels overcrowded while another stays quiet for most of the shift.
The immediate reaction often involves requesting more storage, extending the building, or moving equipment. Those decisions carry cost and disruption. Plant managers need evidence that shows how each area performs before committing money or floor space.
Space utilization metrics turn movement, occupancy, dwell time, and activity patterns into measurable information. They help managers identify congestion, underused zones, unnecessary travel, and capacity constraints that routine walkthroughs may miss.
What Is Space Utilization in a Plant?
Space utilization measures how people, vehicles, equipment, inventory, and work activities use defined areas over time.
Capacity and utilization describe different things. Capacity refers to how much an area could hold or support under specified conditions. Utilization shows how much of that available space the operation actually uses.
A storage zone may have high physical capacity but low daily activity. A narrow transfer point may occupy little floor area yet support hundreds of movements during each shift. Both measurements matter because square footage alone does not show operational value.
Plant managers should assess utilization by zone, shift, activity, and object type. The resulting picture shows where space supports production and where layout decisions create waiting, extra travel, or safety exposure.
Why Floor Area Alone Tells You Very Little
Traditional space reviews often calculate the percentage of floor area assigned to production, storage, offices, utilities, or traffic routes. That information provides a starting point, but it cannot show how the site behaves.
Two areas with the same size may produce very different results:
- One supports steady material flow throughout the day.
- The other becomes crowded for 20 minutes and remains empty afterward.
- One gives vehicles enough turning space.
- The other forces repeated reversing and waiting.
- One holds inventory that moves daily.
- The other stores items that have not moved for months.
Plant managers need measurements that capture time and behavior alongside physical dimensions.
1. Area Occupancy Rate
Area occupancy rate shows how often a defined zone contains people, equipment, vehicles, or inventory during the measurement period.
A basic calculation is:
Occupied time ÷ available operating time × 100
If a loading bay remains occupied for six hours during a ten-hour operating window, its occupancy rate is 60%.
High occupancy does not automatically indicate a problem. A production cell may need consistent activity. A shared staging area operating close to full capacity may create queues because it has little room to absorb variation.
Low occupancy deserves context as well. It may reveal excess capacity, a poorly located resource, a seasonal area, or equipment that teams cannot access easily.
Track occupancy by shift and time block. Daily averages may hide short periods when demand exceeds available space.
2. Peak Occupancy
Peak occupancy records the highest number of people, vehicles, assets, or stored units present in a zone at one time.
This metric helps managers find short, intense periods that an average can conceal. A corridor may appear lightly used across the day but become crowded during shift changes. A staging area might handle normal production and overflow before dispatch.
Compare peak occupancy with the area’s safe and practical limit. Review what happens as activity approaches that threshold:
- Do queues begin to form?
- Do workers leave marked paths?
- Does material movement slow?
- Do vehicles wait or reverse?
- Does access to emergency equipment remain open?
The answers show the point at which high use becomes operational pressure.
3. Average Dwell Time
Dwell time measures how long a person, vehicle, material load, or piece of equipment remains in a zone.
Long dwell may indicate:
- Waiting for the next process
- Missing instructions
- Limited storage capacity
- Slow inspection or approval
- Unavailable handling equipment
- Poor coordination between teams
Different objects need different dwell targets. A finished-goods pallet may wait for scheduled dispatch. A forklift sitting in a narrow aisle for several minutes may obstruct traffic and delay other work.
Measure dwell time by object type and process stage. A single average across all activity can blur the source of delay.
4. Throughput per Square Foot
Throughput per square foot connects site output with the floor area needed to produce, process, store, or move it.
Depending on the operation, output may include:
- Units produced
- Orders picked
- Pallets handled
- Tons processed
- Vehicles loaded
- Completed work orders
A rising figure can show that the plant produces more with the same footprint. A decline may indicate growing work-in-progress, longer travel, equipment constraints, or an unsuitable layout.
Compare similar processes and product types. A high-volume packaging line and a low-volume specialist cell will have different space requirements.
5. Space Use by Shift
The same floor plan can perform differently from one crew to another.
Day-shift activity may overlap with deliveries, office staff, contractors, and maintenance work. Night teams might operate with fewer open storage zones or different equipment assignments. Weekend production can follow another product mix entirely.
Measure occupancy, dwell, traffic, and congestion for each shift. Look for differences such as:
- One crew using temporary storage more often
- Longer queues during a particular handover
- Higher vehicle activity at night
- Underused production zones on weekends
- Different walking routes between teams
The comparison may uncover a scheduling or process issue rather than a shortage of floor area.
6. Congestion Frequency
Congestion frequency counts how often movement slows or stops because too many people, vehicles, or materials compete for the same zone.
Define a congestion event before tracking it. The definition might include a queue above a set length, travel speed below an agreed level, or multiple vehicles waiting at one intersection.
Record:
- Event location
- Start and finish time
- Traffic type
- Production conditions
- Likely cause
- Resulting delay
Repeated congestion at the same location usually points to a layout, timing, or process constraint.
7. Queue Duration
Queue duration measures how long people, vehicles, or materials wait before accessing a resource or area.
Queues may form near:
- Loading bays
- Scanners
- Inspection stations
- Machine cells
- Charging points
- Security gates
- Material pickup zones
Track average and maximum waiting times. A low average can hide occasional delays that disrupt an entire shift.
Connect queue data to downstream effects. Ten minutes of waiting may delay material delivery, extend cycle time, or leave employees without the inputs required to continue working.
8. Travel Distance per Task
Travel distance per task shows how far workers or vehicles move to complete a repeated activity.
Excess movement consumes labor time, equipment capacity, battery power, and aisle space. It can also raise interaction between pedestrians and vehicles.
Measure travel for defined processes such as:
- Collecting raw materials
- Delivering components to a line
- Moving finished goods to storage
- Retrieving tools
- Transferring waste
- Completing quality checks
Compare the intended route with the path people use. A shorter unofficial route may show that the approved layout adds unnecessary movement.
9. Travel Time per Task
Distance and time should be reviewed together. A short route can still take too long when it passes through busy crossings, narrow aisles, doors, or shared work zones.
Break travel time into:
- Movement time
- Waiting time
- Loading or unloading time
- Access delays
This breakdown helps managers find the source of lost time. A layout change may shorten the route but fail to reduce the full task duration because workers still wait at the destination.
10. Route Deviation Rate
Route deviation rate measures how often workers or vehicles leave the expected path.
Repeated deviations may show that:
- The marked route adds too much distance.
- Storage blocks the intended path.
- Visibility is poor at a crossing.
- The route conflicts with normal work.
- Signs or floor markings are unclear.
Managers should investigate the reason before relying on additional reminders or coaching. Behavior often reveals a design problem.
11. Clearway Compliance
Clearway compliance measures how consistently aisles, walkways, exits, vehicle lanes, and access points remain free from obstruction.
Track the number, duration, and location of blockage events. Classify the cause, such as pallets, parked equipment, waste, cleaning carts, or waiting employees.
A route can remain technically open while losing much of its usable width. Partial obstruction can still force pedestrians closer to vehicles or create one-way movement through a two-way aisle.
Review compliance during busy periods, not only during scheduled inspections.
12. Staging Area Turnover
Staging area turnover shows how quickly materials enter and leave temporary holding zones.
Low turnover can turn temporary storage into permanent occupation. The result may include blocked routes, reduced visibility, and less room for incoming work.
Measure:
- Loads entering the zone
- Average dwell time
- Maximum occupancy
- Loads leaving within the target period
- Items exceeding the allowed dwell time
High occupancy and fast turnover may represent a busy but controlled process. High occupancy with slow turnover suggests a downstream constraint.
13. Work-in-Progress Density
Work-in-progress density compares unfinished inventory with the area assigned to hold it.
Rising density can indicate production imbalance. Upstream work may continue faster than downstream teams can process it. The excess then occupies aisles, staging zones, or space beside equipment.
Track work-in-progress by area and process step. Pair the result with dwell time to find where materials wait longest.
Reducing excess work-in-progress can release floor space without changing the building.
14. Underused Area Percentage
Underused area percentage estimates how much assigned space receives little or no activity during the operating period.
Low use may come from:
- Outdated storage assignments
- Seasonal processes
- Decommissioned equipment
- Poor access
- Changes in product mix
- Space reserved for rare events
Do not assume every quiet zone can be removed. Some areas provide surge capacity, safe separation, maintenance access, or emergency clearance.
Review why the space exists before repurposing it.
15. Space-Related Safety Event Rate
This metric connects the layout with reported safety events and observed exposure.
Relevant events may include:
- Pedestrian and vehicle close interactions
- Blocked walkways
- Restricted-area entries
- Unsafe reversing
- Congestion near blind corners
- Emergency access obstructions
Calculate rates against activity where possible. Five events during 100 movements represent a different exposure level from five events during 10,000 movements.
Map events by location and time. Clusters can identify areas where traffic, visibility, or available space needs attention.
16. Changeover Space Recovery Time
Many plants temporarily use extra floor area during product, batch, tool, or equipment changeovers.
Space recovery time measures how long the area takes to return to its normal operating condition after the change ends.
Delayed recovery can leave tools, packaging, unused materials, or mobile equipment in traffic routes. It may also reduce the available area for the next process.
Track recovery time by shift, product type, and team. The comparison can reveal process variation and training needs.
17. Asset-to-Area Ratio
Asset-to-area ratio compares the number of vehicles, machines, carts, racks, or other assets with the floor space assigned to them.
Too many assets in a small zone can reduce turning space, block visibility, and create idle equipment. Too few may cause workers to wait or travel elsewhere.
Pair the ratio with actual asset activity. A crowded equipment zone may still contain vehicles that remain idle for most of the shift.
18. Utilization Variance
Utilization variance measures how much area use changes across shifts, days, or production conditions.
A stable average can hide extreme variation. One zone might operate at 30% occupancy most of the week and exceed its practical capacity during a monthly production run.
Track the spread between normal and peak use. High variance may support flexible staging, temporary route controls, or schedule changes rather than permanent expansion.
How to Collect Better Space Utilization Data
Manual walks, employee feedback, production records, and equipment logs all provide useful information. Each source has limits.
A walkthrough captures a moment. Employees may remember unusual delays more clearly than normal patterns. Production data can show output without explaining how movement or space affected it.
Combine several sources:
- Structured observations
- Floor plans and zone maps
- Production and order data
- Vehicle or equipment records
- Safety event reports
- Frontline interviews
- Continuous movement analysis
Computer vision can extend the measurement period across cameras, zones, shifts, and object types. industrial area utilization metrics can help plant teams compare movement trends, underused zones, congestion, clearway events, and event hotspots across selected operating periods.
Time-lapse review can show how an area changes through the day. Heatmaps reveal concentrated activity, while path analysis shows the routes people and vehicles actually follow.
Normalize Metrics Before Comparing Areas
Raw totals can create misleading comparisons.
A high-volume line will usually record more movements and congestion events than a low-volume cell. That does not mean its layout performs worse.
Normalize measurements against activity:
- Events per 1,000 movements
- Waiting minutes per completed load
- Travel distance per task
- Blocked-route minutes per operating hour
- Output per square foot
Use comparable products, processes, and operating conditions. Note any staffing, equipment, or schedule differences that could affect results.
Build a Plant Space Utilization Scorecard
A useful scorecard should remain small enough for regular review.
Plant managers might select:
- Peak occupancy
- Average dwell time
- Throughput per square foot
- Queue duration
- Travel time per task
- Clearway compliance
- Underused area percentage
- Space-related safety event rate
Set a baseline and target for each measure. Review results by shift and zone. Add a named owner and action for any metric that moves outside the agreed range.
Keep detailed analysis available for investigations, but avoid filling daily meetings with too many numbers.
Use the Data to Test Changes
Metrics should support decisions rather than sit in a report.
Possible changes include:
- Moving staging areas
- Changing storage assignments
- Relocating tools or equipment
- Adjusting shift schedules
- Opening a second access route
- Creating one-way traffic
- Removing idle assets
- Repurposing quiet zones
Test temporary changes first where practical. Measure the same indicators before, during, and after the trial.
Check connected areas as well. A change can clear one zone while creating a queue somewhere else.
Common Space Utilization Measurement Mistakes
Relying on Daily Averages
Averages can hide short periods when an area exceeds practical capacity.
Measuring Square Footage Without Activity
Floor area does not show movement, dwell, waiting, or process value.
Comparing Unrelated Processes
Different products and tasks need different amounts of space.
Treating High Use as Automatic Success
An area operating near full capacity may have no room to absorb demand changes.
Removing Every Quiet Zone
Some low-activity spaces support maintenance, emergency access, separation, or surge demand.
Ignoring Worker Behavior
Shortcuts, queues, and route deviations often show that the planned layout does not match actual work.
Final Thoughts
Plant space carries a cost, but unused floor area is only one part of the problem. Overcrowded routes, long travel, slow staging turnover, and uneven demand can reduce the value of the entire footprint.
Track occupancy, dwell time, movement, queues, clearways, and output together. Compare shifts and normalize results against activity. Then use the findings to test focused changes.
The best space utilization program does not aim to fill every square foot. It gives people, equipment, and materials enough room to move safely while supporting consistent production.
Clear measurements help plant managers decide when to rearrange, repurpose, schedule differently, or invest. They also make it easier to prove that a proposed change addresses a real operating need.